
Facebook ads metrics are numbers that show how your ads perform. They tell you who saw your ad. They show who clicked it and also reveal who actually bought.
Without them, you are guessing. With them, you can fix problems fast.
This guide explains each metric in plain words. You will get formulas, easy examples, and clear next steps. By the end, you will know what to track, what is healthy, and what to change.
Quick Answer: What Are the 10 Key Facebook Ads Metrics?
Here is the short list:
- Click-Through Rate (CTR): how many people click after seeing your ad
- Cost Per Click (CPC): what you pay for each click
- Conversion Rate: how many clicks turn into a goal action
- Return on Ad Spend (ROAS): revenue earned for every rupee or dollar spent
- Cost Per Acquisition (CPA): what you pay to win one customer or result
- Impressions: how many times your ad appeared
- Engagement Rate: how many people interacted with your ad
- Frequency: how often one person saw your ad
- Video View Percentage: how much of your video people watched
- Quality Ranking: how your ad quality compares with rival ads
Let’s see how each one works in real life.
A Small Story: Why Aman Almost Quit Facebook Ads
Aman sells handmade candles online. He spent ₹5,000 on his first Facebook ad. Nothing happened.
He felt stuck. “Facebook ads don’t work,” he told a friend.
His friend asked one question. “Which numbers did you check?”
Aman had checked none. He only watched the sales count.
So they opened Ads Manager together. They found that many people saw the ad but few clicked. The picture was the problem. The offer was fine.
He changed the image and tested a new headline. Within a week, clicks rose and his cost per click dropped.
That one insight saved his budget. This is the power of metrics. They show you where things go wrong. Many beginners learn this skill in digital marketing classes in Kolkata before they spend their own money.

What Are Facebook Ads Metrics?
Facebook ads metrics are data points about your ad campaigns. Meta shows them inside Ads Manager.
Think of them as a car dashboard. The speedometer tells you how fast you go. The fuel gauge tells you how far you can go. Each metric answers one question about your ad.
Note that Facebook ads now run through Meta’s ad system, which also covers Instagram. So these metrics apply to both platforms.
Why Should Beginners Track Facebook Ads Metrics?
Tracking metrics helps you do six things:
- Save money. You stop paying for ads that do not work.
- Measure profit. You see if your ads earn more than they cost.
- Improve ads. You learn which image, video, or headline wins.
- Find the right audience. You see who responds best by age, location, and device.
- Compare campaigns. You learn which ideas work again and again.
- Plan better. Past results help you set realistic goals and budgets.
In short, metrics turn guesses into decisions. They also help you explain results to a boss or client with proof.
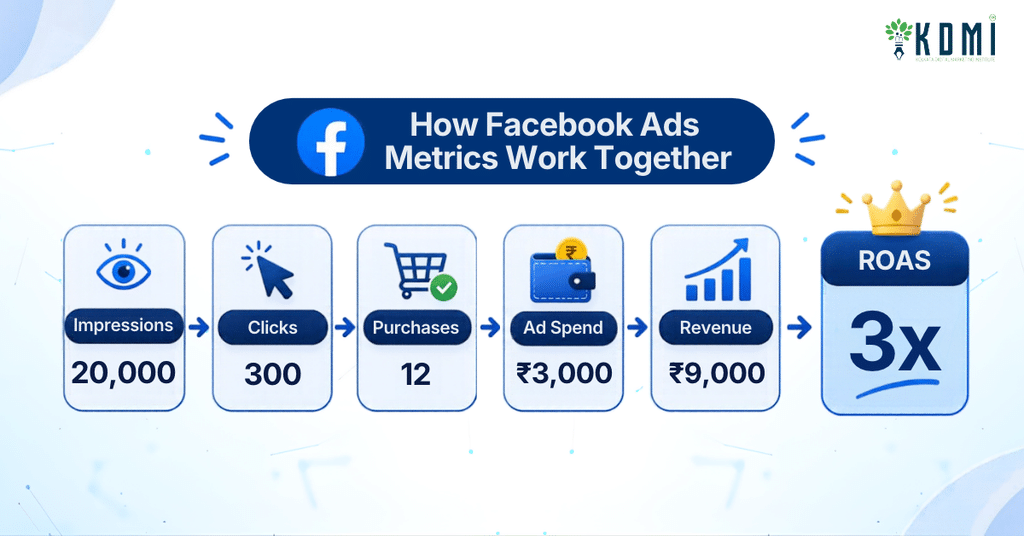
How Do Facebook Ads Metrics Work Together?
Metrics are not separate islands. They form a chain, from the first view to the final sale.
Here is a simple example for one week of ads:
| Step | Metric | Number |
| People saw the ad | Impressions | 20,000 |
| People clicked | Clicks (CTR = 1.5%) | 300 |
| People bought | Purchases (conversion rate = 4%) | 12 |
| You paid | Ad spend | ₹3,000 |
| Cost per click | CPC | ₹10 |
| Cost per customer | CPA | ₹250 |
| You earned | Revenue | ₹9,000 |
| Return | ROAS | 3 |
Now read the chain from left to right. If impressions are low, your ad is not reaching enough people. If clicks are low, your creative is weak. If sales are low, the page or offer needs work. Finding the weakest link is the whole game.
The 11 Facebook Ads Metrics Explained
1. Click-Through Rate (CTR)
CTR is the percentage of people who click your ad after seeing it.
Formula: Clicks ÷ Impressions × 100
Example: Your ad appears 1,000 times. Twenty people click. Your CTR is 2%.
What it tells you: A high CTR means your ad catches attention. A low CTR means your image or headline needs work.
Beginner tip: Meta shows two versions. “CTR (all)” counts every click, including likes and comments. “CTR (link click-through rate)” counts only clicks to your website. For traffic and sales goals, the link version is usually more useful.
Quick fix: Test a new image or a stronger first line.
2. Cost Per Click (CPC)
CPC is the amount you pay each time someone clicks your ad.
Formula: Total spend ÷ Clicks
Example: You spend ₹500 and get 100 clicks. Your CPC is ₹5.
What it tells you: A lower CPC means cheaper traffic. Still, cheap clicks are useless if nobody buys.
Beginner tip: Do not chase the lowest CPC alone. A ₹20 click that buys beats a ₹2 click that never does.
3. Conversion Rate
Conversion rate shows how many clicks end in a goal action. That action can be a purchase, a sign-up, or a call.
Formula: Conversions ÷ Clicks × 100
Example: One hundred people click. Five buy. Your conversion rate is 5%.
What it tells you: If clicks are high but sales are low, look at your landing page. The ad may be fine. The page may be the problem.
Quick fix: Speed up your page, simplify checkout, and match the page message to the ad.
4. Return on Ad Spend (ROAS)
ROAS shows how much money you earn for each unit you spend on ads.
Formula: Revenue from ads ÷ Ad spend
Example: You spend ₹10,000 and earn ₹40,000. Your ROAS is 4.
What it tells you: A ROAS of 4 means every ₹1 brought back ₹4. However, a “good” ROAS depends on your profit margin. A low-margin product needs a higher ROAS to make money.
Beginner tip: Calculate your break-even ROAS first. The formula is 1 ÷ profit margin. With a 25% margin, break-even ROAS is 4. Anything below that loses money.

5. Cost Per Acquisition (CPA)
CPA is what you pay to get one customer or one result. Some tools call it cost per result.
Formula: Total spend ÷ Number of conversions
Example: You spend ₹2,000 and win 20 customers. Your CPA is ₹100.
What it tells you: Compare CPA with your profit per customer. If you earn ₹300 per sale, a ₹100 CPA is healthy. If you earn ₹80, you are losing money.
Beginner tip: For repeat-purchase businesses, compare CPA with customer lifetime value. A higher CPA can still pay off when customers return.
6. Impressions
Impressions count how many times your ad appeared on screens. One person can create several impressions.
What it tells you: High impressions mean wide exposure. Even so, impressions alone do not mean sales. They help most when your goal is brand awareness.
Beginner tip: Impressions and reach are different. Reach counts unique people. Impressions count every view, repeats included.
7. Engagement Rate
Engagement rate measures likes, comments, shares, and saves compared with views.
What it tells you: Strong engagement shows your message connects. Moreover, shares can spread your ad to new people at no extra cost.
Beginner tip: Read the comments. They reveal doubts, questions, and objections. You can answer those in your next ad.
8. Frequency
Frequency is the average number of times one person sees your ad.
Formula: Impressions ÷ Reach
Example: Your ad has 3,000 impressions and reaches 1,000 people. Frequency is 3.
What it tells you: Some repeats help people remember you. Too many repeats cause ad fatigue. People get bored and start ignoring you.
Signs of ad fatigue: Frequency climbs, CTR falls, and CPA rises at the same time. When you see all three, refresh your creative or widen your audience. The right frequency varies by audience and goal, so watch the trend more than one fixed number.
9. Video View Percentage
This metric shows how much of your video people watched. Meta often reports views at 25%, 50%, 75%, and 100%.
What it tells you: If most people leave in the first few seconds, your opening is weak. In that case, put your best moment first.
Beginner tip: Many marketers also track a “hook rate.” It is the number of 3-second views divided by impressions. It shows how well your first moments grab attention. Meta also reports ThruPlays, which count views of 15 seconds or more, or the full video if it is shorter.
10. Quality Ranking
Quality ranking compares your ad’s perceived quality with ads that target the same audience. Meta judges quality using signals such as user feedback and ad experience.
What it tells you: The ranking appears as above average, average, or below average. A below-average rating is a warning sign. Clearer visuals and honest headlines usually help. Avoid clickbait, because users react badly to it.
Beginner tip: Rankings often need enough impressions before they appear. If you do not see them, wait for more data.
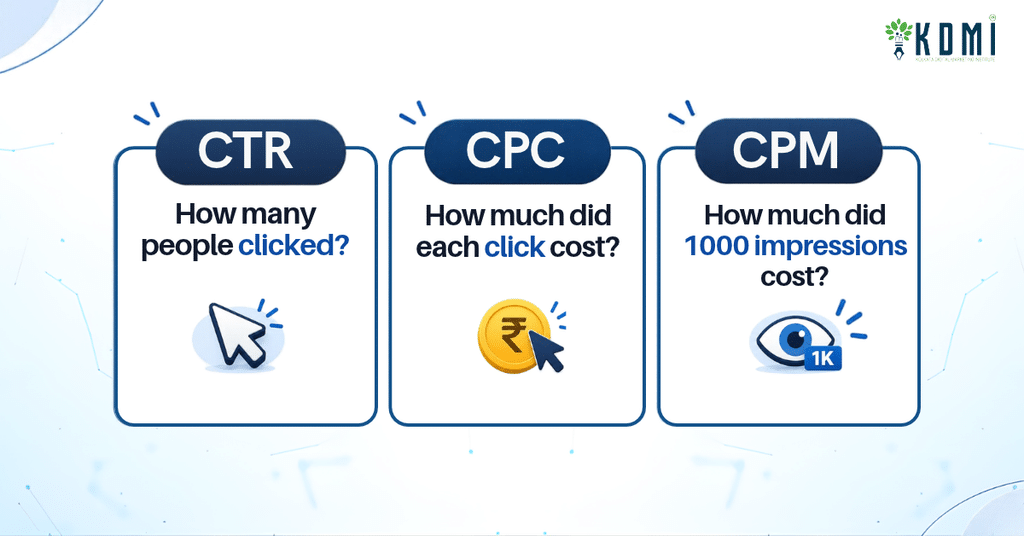
What Is CPM, and What Is the Difference Between CPC and CPM?
CPM is the cost for 1,000 impressions.
Formula: Total spend ÷ Impressions × 1,000
Example: You spend ₹300 to get 5,000 impressions. Your CPM is ₹60.
CPC vs CPM: CPC measures the cost of a click. CPM measures the cost of being seen. Use CPC to judge traffic cost. Use CPM to judge how expensive your audience is to reach.
When CPM rises suddenly, competition may have increased. Seasonal events like festivals can also push it up. A tired ad can have the same effect.
Which Facebook Ads Metrics Should You Watch for Your Goal?
Different goals need different numbers. Use this table:
| Your Goal | Metrics to Watch | Why |
| Brand awareness | Impressions, Reach, Frequency, CPM | Shows how many people you reach and at what cost |
| Website traffic | CTR, CPC | Shows how well ads pull people to your site |
| Leads | CPA, Conversion Rate | Shows the cost and quality of each lead |
| Sales | ROAS, CPA, Conversion Rate | Shows if you earn more than you spend |
| Video reach | Video View Percentage, Engagement Rate | Shows if people stay and interact |
Pick two or three metrics per goal. Too many numbers cause confusion.
What Is a Good CTR, CPC, and ROAS on Facebook Ads?
There is no single magic number. Results change by industry, offer, season, and country.
Many marketers treat a link CTR of around 1% as a rough starting point. Even so, your own history is a better guide. Compare each new ad with your previous ads first. Then compare with recent industry reports.
Here is a smart way to judge each metric:
- CTR: Compare it with your last five ads. Rising CTR is a good sign.
- CPC: Judge it against your conversion rate. A higher CPC is fine when many clicks buy.
- CPA: Compare it with profit per customer.
- ROAS: Compare it with your break-even ROAS.
Quick example: Your product sells for ₹1,000 with a ₹400 profit. Your margin is 40%, so break-even ROAS is 2.5. A ROAS of 3 earns a small profit. A ROAS of 2 loses money.
Why Is My CTR High but My Sales Low?
This is one of the most common beginner questions. It means people like your ad, but something breaks after the click.
Use this table to diagnose the problem:
| What You See | Likely Cause | What to Try |
| Low CTR, low CPC cost efficiency | Weak image or headline | Test new creative and a clearer offer |
| High CTR, low conversion rate | Landing page mismatch or slow page | Match the page to the ad and improve speed |
| High CPC, normal CTR | Strong competition or narrow audience | Widen the audience and test new placements |
| Rising frequency, falling CTR | Ad fatigue | Refresh creative or expand the audience |
| Good conversion rate, high CPA | Expensive clicks | Improve CTR and test new audiences |
| Below-average quality ranking | Clickbait or poor ad experience | Use honest copy and clear visuals |
Change one thing at a time. Otherwise, you will not know what caused the improvement.
Where Do You Find Facebook Ads Metrics in Ads Manager?
Follow these steps:
- Open Meta Ads Manager.
- Select your campaign, ad set, or ad.
- Click Columns.
- Choose Customize columns.
- Tick the metrics you want to see.
- Save the setup as a preset.
Menu names can change over time. If you cannot find an option, check Meta’s Business Help Center.
Pro tip: Use the Breakdown button to split results by age, gender, placement, or device. This often reveals a hidden winner. For example, your ad may work well on Instagram Reels but poorly in Facebook Feed.
How Do You Set Up Tracking So Your Metrics Are Accurate?
Bad tracking gives bad numbers. Set up these basics before you trust any report:
- Meta Pixel: a small code on your website that records actions like purchases and sign-ups.
- Conversions API: a server-side connection that sends events to Meta. It helps recover data that browsers may block.
- UTM tags: short tags added to your ad links. They let Google Analytics show which ad brought each visitor.
- Event testing: use Meta’s testing tools to confirm that each event fires once and fires correctly.
Also know your attribution window. This is the time period in which Meta credits a sale to your ad. A common default is a 7-day click and 1-day view. Your numbers may differ from other tools because each tool counts differently. That is normal.
How Often Should You Check Your Metrics?
Checking too often leads to panic. Checking too rarely wastes money.
Here is a simple routine:
- Daily (2 minutes): Check spend and any sudden drops or spikes.
- Every 3 to 4 days: Review CTR, CPC, and frequency.
- Weekly: Review CPA, ROAS, and creative winners. Pause weak ads and scale strong ones.
- Monthly: Review trends, compare campaigns, and plan next month’s tests.
After you launch a new ad, Meta needs time to learn. Avoid big edits in the first few days, because each edit can restart the learning phase.
How Do You Build a Simple Facebook Ads Report?
A clear report helps you and your boss or client. Here is an easy method:
- Set your goal. Decide if you want awareness, leads, or sales.
- Choose key metrics. Match them to the goal.
- Add a time range. Show trends across days or weeks.
- Use charts. Visuals are quicker to read than tables.
- Explain the “why.” Add context for any big change, such as a festival sale or a new offer.
- Share wins. Point out what worked well.
- Suggest next steps. Say what you will test next.
- Write a summary first. Busy readers will thank you.
You can also add custom metrics. Lead quality is one example. Another is how far people move through your sales funnel.
What Are the Most Common Facebook Ads Mistakes Beginners Make?
- Chasing impressions only. Big reach feels good. Yet it may bring no sales.
- Judging too early. Give ads a few days to gather data.
- Ignoring the landing page. A great ad cannot fix a weak page.
- Changing everything at once. You then cannot tell what worked.
- Skipping profit math. Always compare cost with your margin.
- Trusting broken tracking. Test your Pixel and events first.
- Never refreshing creative. Even winning ads tire out over time.
Final Thoughts: Start Small and Read the Clues
Metrics are not scary. They are simple clues.
Remember Aman. He did not need a bigger budget. He only needed to read the right numbers.
Start small. Pick one goal and track two or three metrics. Test one change at a time. Over time, you will build real confidence.
Your next step: Open Ads Manager today. Customize your columns. Then check your CTR, CPC, and conversion rate.
Want guided practice on live campaigns? Explore our digital marketing classes in Kolkata and learn Facebook ads step by step.
